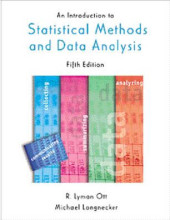
Summary: An Introduction To Statistical Methods And Data Analysis | 9780534251222 | Lyman Ott, et al
- This + 400k other summaries
- A unique study and practice tool
- Never study anything twice again
- Get the grades you hope for
- 100% sure, 100% understanding
Read the summary and the most important questions on An Introduction to Statistical Methods and Data Analysis | 9780534251222 | Lyman Ott; Michael Longnecker
-
1 Statistics and the scientific method
This is a preview. There are 1 more flashcards available for chapter 1
Show more cards here -
1.1 Introduction
This is a preview. There are 2 more flashcards available for chapter 1.1
Show more cards here -
How do we approach the study of statistics? Name the four steps.
1. defining the problem
2. collecting the data
3. summarizing the data
4. analyzing data -
3 Data description
This is a preview. There are 3 more flashcards available for chapter 3
Show more cards here -
What is meant with a binomial distribution?
This is the distribution that handles with 2 outcomes which are for success and failure. It is the distribution for discrete variables. -
3.3 Describing Data on a Single Variable: Graphical Methods
This is a preview. There are 4 more flashcards available for chapter 3.3
Show more cards here -
The results of an exam are given in grades between 1 and 10 with steps of a half (so 1, 1.5, ...,9.5, 10). Which of the following graphs is the most appropriate to depicture the distribution of the grades?A. a bar-chart;B. a histogram;C. a scatterplot;D. a QQ-plot.
B. Because for a discrete variable with lots of distinct outcomes (measured in classes) one can plot a histogram. -
3.6 The boxplot
This is a preview. There are 2 more flashcards available for chapter 3.6
Show more cards here -
Should a boxplot be created for small sample sizes?
No. -
4 Probability and Probability distributions
-
4.1 How Probability Can Be Used in Making Inferences
This is a preview. There are 4 more flashcards available for chapter 4.1
Show more cards here -
What is meant with 'the classical interpretation of probability' and what formula belongs to this definition?
These are typical probability statements that arise from games of chance, assuming that all outcomes are equally likely (like rolling a dice that not is manipulated). The formula to calculate this classical interpratation of probability is as followed: P(event E)=Ne/N -
What is meant with 'the relative frequency concept of probability' and what formula belongs to this definition?
This is an empirical approach to probability. If an event occurs a multiple times in an experimented that is repeated a large number of times, then an approximation of the probability of this certain event can be made. This is calculated as followed: P(event E)=ne/n. -
What is meant with 'the personal or subjective probability'?
This can be used for problems in which it is difficult to imagine a repetition of an experiment (one shot situations) to make a statement. ("The chance that my parents will agree that I use their house as a party-location is 20%") -
4.3 Basic Event Relations and Probability Laws
This is a preview. There are 4 more flashcards available for chapter 4.3
Show more cards here -
What properties must two mutually exclusive events satisfy?
1. The probability of both must lie between the interval from 0 to 1.
2. The probability of either A or B can be added together (summed)
3. The probability of 'occuring' and 'not occuring' of both events should be 1, if you add them together. -
4.6 Variables: Discrete and Continouous
This is a preview. There are 6 more flashcards available for chapter 4.6
Show more cards here -
Name 3 examples of qualitative variables
Political party affiliation, socioeconomic status, the species of insect discovered on an apple leaf, and the brand preferences of customers. -
Name 3 examples of quantative variables
The change in earnings per share of a stock over the next quarter, the length of time a patient is in remission after a cancer treatment, the yield per acre of a new variety of wheat, and the number of persons voting for the incumbent in an upcoming election.
- Higher grades + faster learning
- Never study anything twice
- 100% sure, 100% understanding


